Third edition of Artificial Intelligence: foundations of computational agents, Cambridge University Press, 2023 is now available (including the full text).
13.2.2 Graphical Representations
You can interpret the prop relation in terms of a graph, where the relation
prop(Ind , Prop , Val)
is depicted with Ind and Val as nodes with an arc labeled with Prop between them. Such a graph is called a semantic network. Given such a graphical representation, there is a straightforward mapping into a knowledge base using the prop relation.
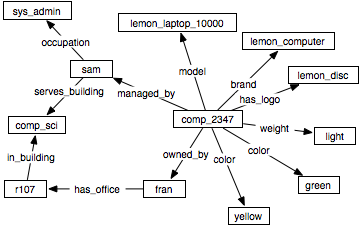
prop(comp_2347 , managed_by , sam).
prop(comp_2347 , model , lemon_laptop_10000).
prop(comp_2347 , brand , lemon_computer).
prop(comp_2347 , has_logo , lemon_disc).
prop(comp_2347 , color , green).
prop(comp_2347 , color , yellow).
prop(comp_2347 , weight , light).
prop(fran , has_office , r107).
prop(r107 , in_building , comp_sci).
The network also shows how the knowledge is structured. For example, it is easy to see that computer number 2347 is owned by someone (Fran) whose office (r107) is in the comp_sci building. The direct indexing evident in the graph can be used by humans and machines.
This graphical notation has a number of advantages:
- It is easy for a human to see the relationships without being required to learn the syntax of a particular logic. The graphical notation helps the builders of knowledge bases to organize their knowledge.
- You can ignore the labels of nodes that just have meaningless names - for example, the name b123 in Example 13.6, or comp_2347 in Figure 13.1. You can just leave these nodes blank and make up an arbitrary name if you must map to the logical form.
