Third edition of Artificial Intelligence: foundations of computational agents, Cambridge University Press, 2023 is now available (including the full text).
7.2.1 Evaluating Predictions
If e is an example, a point estimate for target feature Y is a prediction of a particular value for Y on e. Let pval(e,Y) be the predicted value for target feature Y on example e. The error for this example on this feature is a measure of how close pval(e,Y) is to val(e,Y), where val(e,Y) is the actual value for feature Y in e.
For regression, when the target feature Y is real valued, both pval(e,Y) and val(e,Y) are real numbers that can be compared arithmetically.
For classification, when the target feature Y is a discrete variable, a number of alternatives exist:
- When Y is binary, one value can be associated with 0, the other value with 1, and a prediction can be some real number. The predicted and actual values can be compared numerically.
- When the domain of Y has more than two values, sometimes the values are totally ordered and can be scaled so a real number can be associated with each value of the domain of Y. In this case, the predicted and actual values can be compared on this scale. Often, this is not appropriate even when the values are totally ordered; for example, suppose the values are short, medium, and long. The prediction that the value is short ∨ long is very different from the prediction that the value is medium.
- When the domain of Y is {v1,...,vk}, where k>2, a separate prediction can be made for each vi. This can be modeled by having a binary indicator variable associated with each vi which, for each example, has value 1 when the example has value vi and the indicator variable has value 0 otherwise. For each training example, exactly one of the indicator variables associated with Y will be 1 and the others will be 0. A prediction gives k real numbers - one real number for each vi.
One representation is to have a real-valued variable Y that is the number of days in the holiday.
Another representation is to have six real-valued variables, Y1,...,Y6, where Yi represents the proposition that the person would like to stay for i days. For each example, Yi=1 when there are i days in the holiday, and Yi=0 otherwise.
The following is a sample of five data points using the two representations:
| Example | Y |
| e1 | 1 |
| e2 | 6 |
| e3 | 6 |
| e4 | 2 |
| e5 | 1 |
| Example | Y1 | Y2 | Y3 | Y4 | Y5 | Y6 |
| e1 | 1 | 0 | 0 | 0 | 0 | 0 |
| e2 | 0 | 0 | 0 | 0 | 0 | 1 |
| e3 | 0 | 0 | 0 | 0 | 0 | 1 |
| e4 | 0 | 1 | 0 | 0 | 0 | 0 |
| e5 | 1 | 0 | 0 | 0 | 0 | 0 |
A prediction for a new example in the first representation can be any real number, such as Y=3.2.
In the second representation, the learner would predict a value for each Yi for each example. One such prediction may be Y1=0.5, Y2=0.3, Y3=0.1, Y4=0.1, Y5=0.1, and Y6=0.5. This is a prediction that the person may like 1 day or 6 days, but will not like a stay of 3, 4, or 5 days.
In the following definitions, E is the set of all examples and T is the set of target features.
There are a number of prediction measures that can be defined:
- The absolute error on E is
the sum of the absolute errors of the predictions on each example. That is,
∑e∈E ∑Y∈T|val(e,Y)-pval(e,Y)|.
This is always non-negative, and is only zero when the predictions exactly fit the observed values.
- The sum-of-squares error on E is
∑e∈E ∑Y∈T (val(e,Y)-pval(e,Y))2.
This measure treats large errors as worse than small errors. An error twice as big is four times as bad, and an error 10 times as big is 100 times worse.
- The worst-case error on E is
the maximum absolute error:
maxe∈E maxY∈T|val(e,Y)-pval(e,Y)|.
In this case, the learner is evaluated by how bad it can be.
(0.7,1.7),(1.1,2.4),(1.3,2.5),(1.9,1.7),(2.6,2.1),(3.1,2.3),(3.9,7).
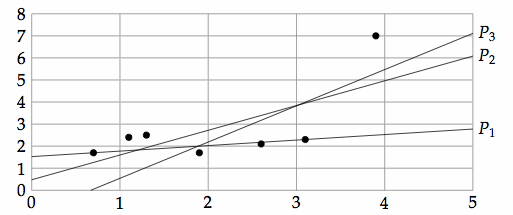
Figure 7.2 shows a plot of the training data (filled circles) and three lines, P1, P2, and P3, that predict the Y-value for all X points. P1 is the line that minimizes the absolute error, P2 is the line that minimizes the sum-of-squares error, and P3 minimizes the worst-case error of the training examples.
Lines P1 and P2 give similar predictions for X=1.1; namely, P1 predicts 1.805 and P2 predicts 1.709, whereas the data contain a data point (1.1,2.4). P3 predicts 0.7. They give predictions within 1.5 of each other when interpolating in the range [1,3]. Their predictions diverge when extrapolating from the data. P1 and P3 give very different predictions for X=10.
The difference between the lines that minimize the various error measures is most pronounced in how they handle the outlier examples, in this case the point (3.9,7). The other points are approximately in a line.
The prediction with the least worse-case error for this example, P3, only depends on three data points, (1.1,2.4), (3.1,2.3), and (3.9,7), each of which has the same worst-case error for prediction P3. The other data points could be at different locations, as long as they are not farther away from P3 than these three points.
In contrast, the prediction that minimizes the absolute error, P1, does not change as a function of the actual Y-value of the training examples, as long as the points above the line stay above the line, and those below the line stay below. For example, the prediction that minimizes the absolute error would be the same, even if the last data point was (3.9,107) instead of (3.9,7).
Prediction P2 is sensitive to all of the data points; if the Y-value for any point changes, the line that minimizes the sum-of-squares error will change.
There are a number of prediction measures that can be used for the special case where the domain of Y is {0,1}, and the prediction is in the range [0,1]. These measures can be used for Boolean domains where true is treated as 1, and false is treated as 0.
- The
likelihood of the data is the probability of the
data when the predicted value is interpreted as a probability:
∏e∈E ∏Y∈T pval(e,Y)val(e,Y)(1-pval(e,Y))(1-val(e,Y)).
One of val(e,Y) and (1-val(e,Y)) is 1, and the other is 0. Thus, this product uses pval(e,Y) when val(e,Y)=1 and (1-pval(e,Y)) when val(e,Y)=0. A better prediction is one with a higher likelihood. The model with the greatest likelihood is the maximum likelihood model.
- The entropy of the data is the number of bits it will
take to encode the data given a code that is based on pval(e,Y) treated
as a probability. The entropy is
-∑e∈E ∑Y∈T [val(e,Y) log pval(e,Y) + (1-val(e,Y)) log (1-pval(e,Y))].
A better prediction is one with a lower entropy.
A prediction that minimizes the entropy is a prediction that maximizes the likelihood. This is because the entropy is the negative of the logarithm of the likelihood.
- Suppose the predictions are
also restricted to be {0,1}. A false-positive error is a positive prediction that is wrong
(i.e., the predicted value is 1, and the actual value is 0). A
false-negative error is a negative prediction that is wrong
(i.e., the predicted value is 0, and the actual value is 1). Often
different costs are associated with the different sorts of errors. For example, if
there are data about whether a product is safe, there may be
different costs for claiming it is safe when it is not safe, and for
claiming it is not safe when it is safe.
We can separate the question of whether the agent has a good learning algorithm from whether it makes good predictions based on preferences that are outside of the learner. The predicting agent can at one extreme choose to only claim a positive prediction when it is sure the prediction is positive. At the other extreme, it can claim a positive prediction unless it is sure the prediction should be negative. It can often make predictions between these extremes.
One way to test the prediction independently of the decision is to consider the four cases between the predicted value and the actual value:
actual positive actual negative predict positive true positive (tp) false positive (fp) predict negative false negative (fn) true negative (tn) Suppose tp is the number of true positives, fp is the number of false positives, fn is the number of false negatives, and tn is the number of true negatives. The precision is (tp)/(tp+fp), which is the proportion of positive predictions that are actual positives. The recall or true-positive rate is (tp)/(tp+fn), which is the proportion of actual positives that are predicted to be positive. The false-positive error rate is (fp)/(fp+tn), which is the proportion of actual negatives predicted to be positive.
An agent should try to maximize precision and recall and to minimize the false-positive rate; however, these goals are incompatible. An agent can maximize precision and minimize the false-positive rate by only making positive predictions it is sure about. However, this choice worsens recall. To maximize recall, an agent can be risky in making predictions, which makes precision smaller and the false-positive rate larger. The predicting agent often has parameters that can vary a threshold of when to make positive predictions. A precision-recall curve plots the precision against the recall as these parameters change. An ROC curve, or receiver operating characteristic curve, plots the false-positive rate against the false-negative rate as this parameter changes. Each of these approaches may be used to compare learning algorithms independently of the actual claim of the agent.
- The prediction can be seen as an action of the predicting agent. The agent should choose the action that maximizes a preference function that involves a trade-off among the costs associated with its actions. The actions may be more than true or false, but may be more complex, such as "proceed with caution" or "definitely true." What an agent should do when faced with uncertainty is discussed in Chapter 9.
In the first representation, the prediction that minimizes the sum of absolute errors on the training data presented in Example 7.2 is 2, with an error of 10. The prediction that minimizes the sum-of-squares error on the training data is 3.2. The prediction the minimizes the worst-case error is 3.5.
For the second representation, the prediction that minimizes the sum of absolute errors for the training examples is to predict 0 for each Yi. The prediction that minimizes the sum-of-squares error for the training examples is Y1=0.4, Y2=0.1, Y3=0, Y4=0, Y5=0, and Y6=0.4. This is also the prediction that minimizes the entropy and maximizes the likelihood of the training data. The prediction that minimizes the worst-case error for the training examples is to predict 0.5 for Y1, Y2, and Y6 and to predict 0 for the other features.
Thus, whichever prediction is preferred depends on how the prediction will be evaluated.
