Artificial
Intelligence 3E
foundations of computational agents
7.5 Composite Models
Decision trees and (squashed) linear functions provide the basis for many other supervised learning techniques. Although decision trees can represent any discrete function, many simple functions have very complicated decision trees. Linear functions and linear classifiers (without inventing new features) are very restricted in what they can represent.
One way to make the linear function more powerful is to have the inputs to the linear function be some nonlinear function of the original inputs. Adding these new features can increase the dimensionality, making some functions that were not linear (or linearly separable) in the lower-dimensional space linear in the higher-dimensional space.
Example 7.20.
The exclusive-or function, , is linearly separable in the space where the dimensions are , , and , where is a feature that is true when both and are true. To visualize this, consider Figure 7.13(c); with the product as the third dimension, the top-right point will be lifted out of the page, allowing for a linear separator (in this case a plane) to go underneath.
A kernel function is a function that is applied to the input features to create new features. For example, a product of features could either replace or augment the existing features. Adding such features can allow for linear separators where there was none before. Another example is, for a feature , adding and to the features allows a linear learner to find the best degree-3 polynomial fit. Note that when the feature space is augmented, overfitting can become more of a problem. The use of the term kernel function is often restricted to cases where learning in the augmented space can be implemented very efficiently, but that is beyond the scope of this book.
Neural networks (Chapter 8) allow the inputs to the (squashed) linear function to be a squashed linear function with weights to be tuned. Having multiple layers of squashed linear functions as inputs to (squashed) linear functions allows more complex functions to be represented.
Another nonlinear representation is a regression tree, which is a decision tree with a constant function at each leaf, which represents a piecewise constant function. A decision tree for regression with a linear function at each leaf represents a piecewise linear function. It is even possible to have neural networks or other classifiers at the leaves of the decision tree. To classify a new example, the example is filtered down the tree, and the classifier at the leaves is then used to classify the example.
Another possibility is to use a number of classifiers that have each been trained on the data and to combine their outputs using mode, median, or mean, depending on the loss function (see Figure 7.5). In ensemble learning, an agent takes a number of learners and combines their predictions to make a prediction for the ensemble. The algorithms being combined are called base-level algorithms.
One simple yet effective composite model is to have an ensemble of decision trees, known as a random forest. The idea is to have a number of decision trees, each of which can make a prediction on each example. Once the trees have been trained, the predictions on the trees are combined, using a method appropriate for the optimality criterion, such as the mode of the tree predictions for maximizing accuracy or the mean of the tree predictions for minimizing squared error or log loss.
In order to make this work effectively, the trees that make up the forest need to make diverse predictions. There are a number of ways that you can ensure diversity, including:
-
•
Each tree could use a different subset of the examples to train on. If there are many examples, each tree could use just a random subset of them. In bagging, a random subset (with replacement) of examples – the same size as the dataset – is selected for each tree to train on. In each of these sets, some examples are not chosen and some are duplicated. On average, each set contains about 63% of the original examples.
-
•
A subset of the conditions could be used for each tree (or each split). Rather than considering all of the conditions when selecting a split, a random subset of them (e.g., a third of them) could be made available to split on.
7.5.1 Boosting
In boosting, there is a sequence of learners in which each one learns from the errors of the previous ones. The features of a boosting algorithm are:
-
•
There is a sequence of base learners (that may be different from each other or the same as each other), such as small decision trees or (squashed) linear functions.
-
•
Each learner is trained to fit the examples that the previous learners did not fit well.
-
•
The final prediction uses a mix (e.g., sum, weighted mean, or mode) of the predictions of each learner.
The base learners can be weak learners, in that they do not need to be very good; they just need to be better than random. These weak learners are then boosted to be components in the ensemble that performs better than any of them.
A simple boosting algorithm is functional gradient boosting, which can be used for regression as follows. The algorithm is given the hyperparameter , which is the number of rounds of boosting, corresponding to the number of base learners in the ensemble. The final prediction, as a function of the inputs, is the sum
where is an initial prediction, say the mean, and each is the difference from the previous prediction. The th prediction is
Then . Each is constructed so that the error of is minimal, given that is fixed. At each stage, the base learner learns to minimize
for any loss based on the difference between the actual and predicated value. This includes the losses considered for real-valued target features, but does not include log loss, which is not of this form.
The th learner learns to fit . This is equivalent to learning from a modified dataset, where the previous prediction is subtracted from the actual value of the training set. In this way, each learner is made to correct the errors of the previous prediction.
The algorithm is shown in Figure 7.19. Each is a function that, given an example, returns a prediction for that example. is a new set of examples, where for each , the latest prediction, , is subtracted from the value of the target feature . The new learner is therefore learning from the errors of the old learner. The function is computed by applying the base learner to the examples .
could either be stored or the new targets for the examples can be generated as needed.
Example 7.21.
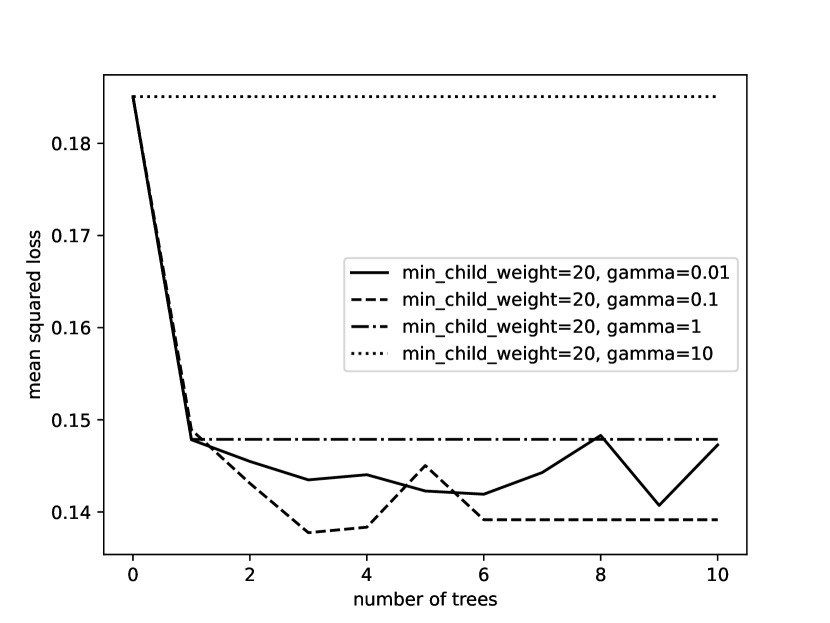
Figure 7.20 shows a plot of the squared error of the validation set as the number of trees increases for functional gradient boosting of decision trees. The different lines are for different values of the parameter in the decision tree learner. This is for the case where the minimum child size is 20 (no nodes have fewer than 20 examples). The point for zero trees is the error for predicting the mean. When , the trees are degenerate and it always predicts the mean. The other values of have similar errors for a single tree. When , the subsequent trees do not extract useful information. For both the other values of , boosting helped improve the prediction. The code is available as part of AIPython (aipython.org).
7.5.2 Gradient-Boosted Trees
Gradient-boosted trees are a mix of some of the techniques presented previously. They are a linear model where the features are decision trees with binary splits, learned using boosting.
Let be the number of boosting rounds, which corresponds to the number of decision trees in the linear model.
For regression, the prediction for example is
where each is a decision tree. Each decision tree is represented by a vector of weights, , one weight for each leaf, and a function that maps the input features into the corresponding leaf. is an implementation of the if–then–else structure of the tree. is the th component of . The value of the decision tree applied to an example with input feature values is , the weight for the leaf numbered . is the number of leaves in the tree, which is one more than the number of splits in the tree.
For regression, the loss function is the regularized squared error
The regularization term , where is the vector of weights for ; and are nonnegative numbers. This allows for regularizing on both the size of the tree and the values of the parameters.
For classification, the prediction is the sigmoid (or softmax) of the sum of trees
and the error to be optimized is the sum of log loss with the same regularization term used for regression:
Choosing Leaf Values
The model is learned using boosting, so the trees are learned one at a time. Consider building the th tree, where the previous trees are fixed. Assume for now that the tree structure () for the th tree is fixed. Consider a single weight that is used for the examples that map to the th leaf of the tree. Let , the set of training examples that map to the th leaf.
When choosing the value of to minimize loss, does not depend on the value of and so can be ignored in the minimization.
The th tree is learned with the previous ones fixed. For regression, the loss for the th tree is
where is the regularization values for the previous trees and the size, which can be ignored when learning the parameters for the th tree.
Ignoring the constant, this is the same as the squared error of the dataset of differences between the observed values and the previous trees, for those examples that map to this leaf, with extra pseudo-examples of value 0. Thus,
where is the previous prediction for example .
For classification, the prediction is the sigmoid (or softmax) of the sum of trees, and the error to be optimized for the th tree is log loss with regularization:
where the constant again can be ignored in the minimization.
Taking the derivative of the loss with respect to :
where the sum is over examples in because the predicted value is constant with respect to outside of this set. Finding the weights where the derivative is zero, which would be a minimum, is difficult to solve analytically.
For classification, starting with each in the new tree as zero, a single step in the opposite direction of the gradient gives the weights for a new tree. A second-order approximation (based on the Newton–Raphson method, which we do not cover) provides a step size for the weight:
where is the previous prediction for example .
Choosing Splits
What remains is to choose the tree structure: choosing the splits of the tree. This is done in a greedy fashion (as in the decision-tree learner of Figure 7.9). Initially, the tree has a single leaf. The algorithm searches for a best leaf to expand. For each leaf, it chooses a feature to split by searching through the choices to make the split that most decreases the loss. For small datasets, the best split can be found by sorting the values on the feature and testing every split. For larger datasets, suggested splits can be made by subsampling the data or using pre-computed percentiles.
The regularization term gives a direct penalty for larger trees; splitting stops when the optimal split does not decrease the loss by at least . Note that the regularization parameter, , when positive, also penalizes larger trees: consider a split that provides no information; with the split, applied to each child provides more regularization because each child has fewer examples, and so will fit the training data worse.
The implementation of gradient-tree boosting for classification shown in Figure 7.21 calls the decision-tree learner of Figure 7.9 iteratively, once for each decision tree in the ensemble. The gradient-boosted-tree learner overrides the function called by . The leaf value is no longer the prediction for each example that reaches the leaf, but is a component that goes into predicting the target value of examples that reach the leaf. The function returns a bag containing each member of chosen with probability , without replacement. This allows for regularization by subsampling the data or the features.
There are a number of hyperparameters that are used in Figure 7.21 to reduce overfitting:
-
•
, the number of boosting rounds, which is the number of trees in the resulting ensemble.
-
•
, the regularization term.
-
•
, the penalty for increasing the number of leaves by 1.
-
•
, the amount the weights for a tree are shrunk to make the algorithm more conservative.
-
•
, the proportions of columns (features) that are used .
-
•
, the proportion of the data used for each tree; e.g., if , then 80% of the data is selected for each tree.
The corresponding parameter names and default values for the open-source packages XGBoost and LightGBM are given in Appendix B.1.
Other common hyperparameters include:
-
•
The maximum depth of a tree.
-
•
The minimum number of training examples that map to a child for a split to be considered.
-
•
The maximum number of leaves in a tree. Note that this value is a property of the whole tree and is not a property of a single node. If used as a criterion to stop when the number of leaves has been reached, the result depends on how the leaves are selected. Rather than the depth-first algorithm of Figure 7.9, it is common to enumerate the leaves in a best-first manner (choosing the best split based on all of the leaves).
Artificial Intelligence: Foundations of Computational Agents, Poole
& Mackworth
Copyright © 2023, David L. Poole and Alan K. Mackworth. 
This work is licensed under a Creative Commons Attribution-NonCommercial-NoDerivatives 4.0 International License.